
S.T.A. DATA offers software and services for structural calculation. Practical, truly operational tools, created by a team of expert professionals, to solve every need.

The innovative FME calculation method (Frame by Macro Elements) is the winning weapon of 3Muri project!
To develop it, we collaborated with the research team led by Prof. Sergio Lagomarsino, full professor of Structural Engineering at the University of Genoa, together with other specialists (Prof. Andrea Penna, University of Pavia; Prof. Serena Cattari, University of Genoa; and Eng. Alessandro Galasco, EUCENTRE, Pavia).
The theoretical foundations of 3Muri Project derive from laboratory experiments and analyses of real structures which, combined with a modeling and results-consultation system, make 3Muri Project a top-tier software in its category.
Authoritative confirmation has come from numerous national and international Universities and Research Centers, which have chosen 3Muri Project to carry out dedicated tests. The result? Total efficiency and reliability, demonstrated by the positive comparison between the seismic effects on real structures damaged by recent earthquakes (L’Aquila and Emilia) and the numerical results.
The numerous configurations in which 3Muri Project is offered meet all the needs of designers, from the most complex to the simplest structures.
The analysis of the structure in 3Muri is divided into two phases: in the first, the equivalent frame model is automatically generated; in the second, the nonlinear static (pushover) analysis is performed, from which the capacity curve of the structure is obtained (force–displacement curve of the control point). The result of the equivalent frame model generation is a mesh that schematizes the structure into piers, spandrels, beams, ties, and columns. These elements can still be modified manually to account for particular situations.
The nonlinear analysis, on the other hand, is carried out by monotonically increasing the loads and determining the horizontal displacement of the structure. Once a conventional displacement value, automatically calculated, is exceeded, the structure is considered to have collapsed, and the Horizontal Force – Horizontal Displacement curve can be constructed, representing the offered capacity curve, i.e., the behavior of the structure as horizontal loads vary.

Graphic area dedicated to the analysis and presentation of results.
Once the geometry of the building has been defined, the 3Muri software allows the automatic determination of the equivalent frame through an algorithm that recognizes the connections between masonry panels and subdivides them into rigid elements, piers, and spandrels, creating the structure to be analyzed.
Thanks to an advanced mesh generator, specifically designed for masonry, even highly complex situations can be examined, always yielding engineeringly correct and reliable results.
Below, a structure automatically schematized with the equivalent frame is presented, with the automatic determination of piers, spandrels, and rigid elements, taking into account openings, adjoining walls, and external constraints.
3Muri enables interoperability with the BIM methodology through the IFC (Industry Foundation Classes) format, whose specifications are based on a neutral data format specifically designed to describe, exchange, and share project information.
3Muri allows the import of geometries from IFC models thanks to the BIM Inside application, included in the module. In this way, the geometries of the objects can be used for building the model.
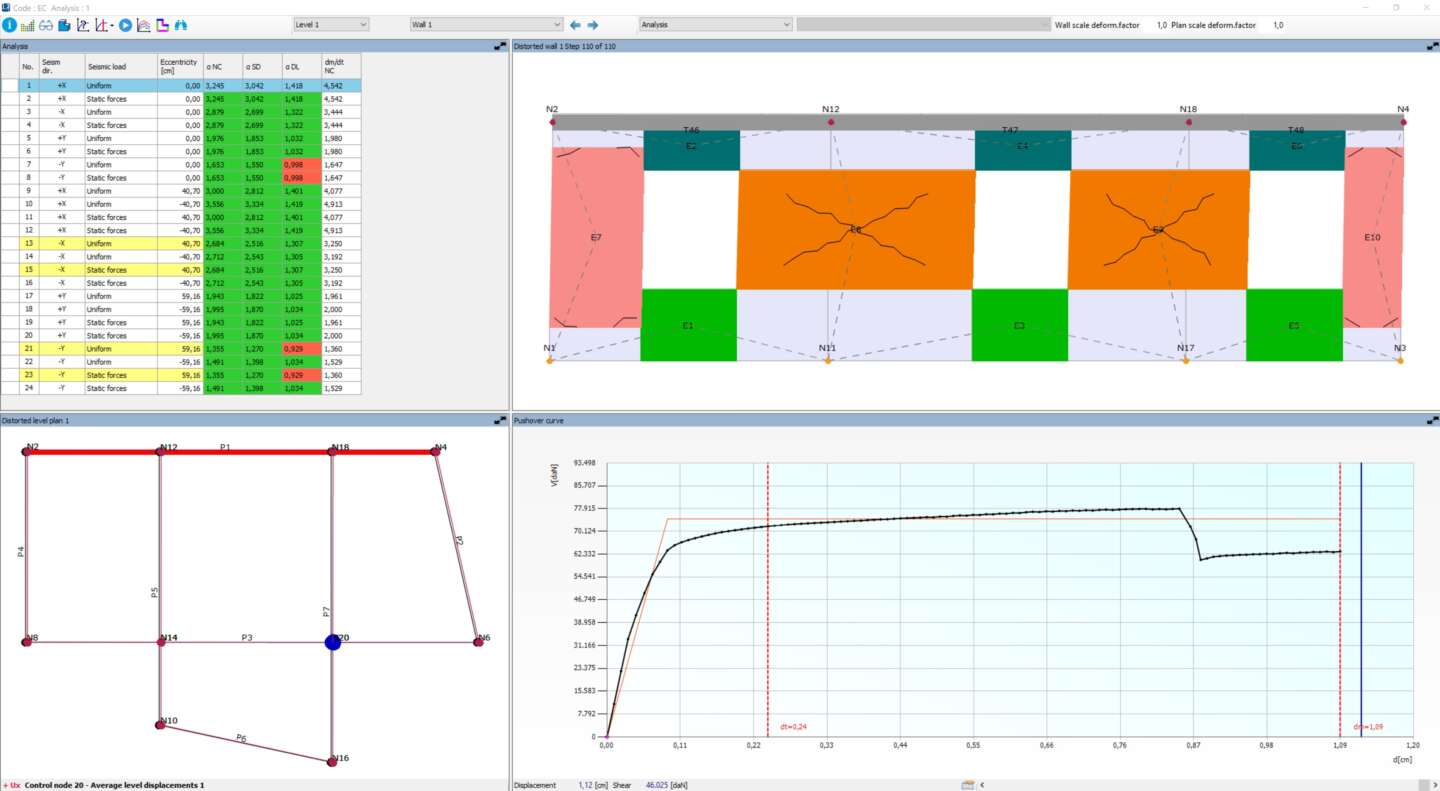
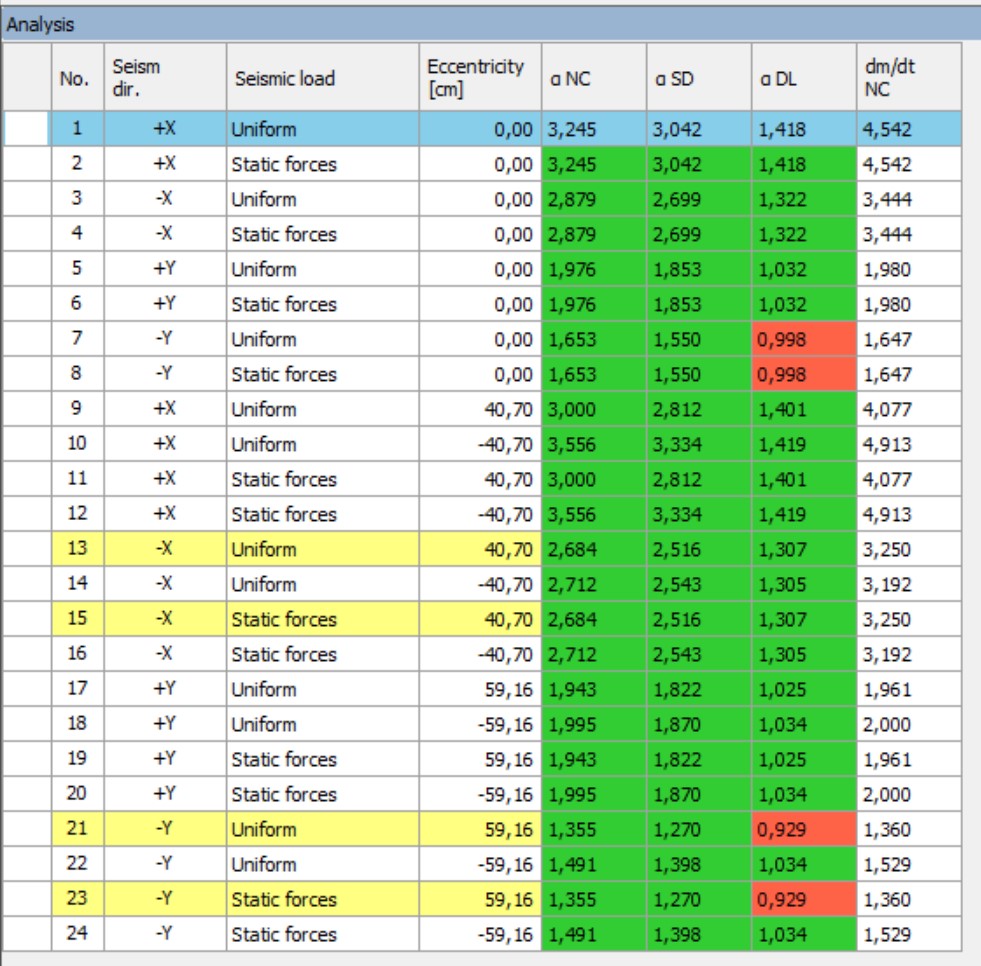
For each analysis, the pushover curve and the bilinear schematization of the equivalent system are presented. Depending on the selected code, the corresponding verification conditions are displayed.
It is possible to examine any parameter of the building’s response, in order to properly understand the structural behavior. This data is necessary to best design any seismic retrofitting or improvement interventions.
The right-hand limit of the curve indicates the displacement capacity provided by the structure. The vertical red bar indicates the minimum displacement required by the code.
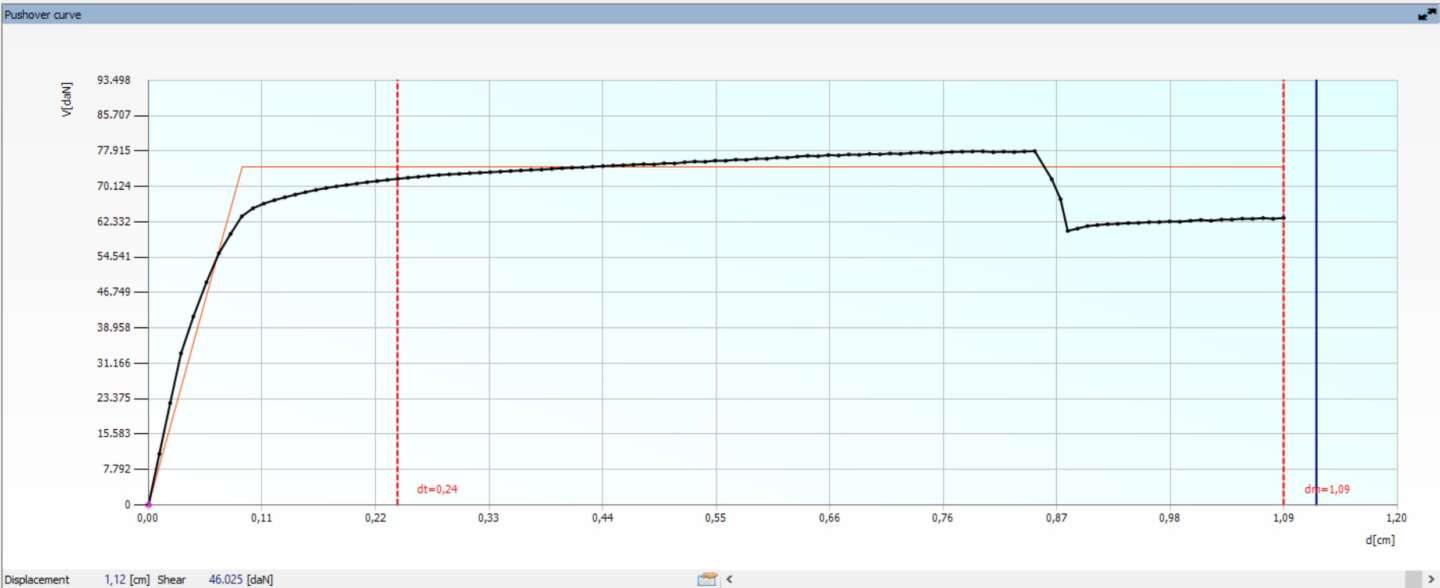
If this value is lower than the right-hand limit of the curve, the structure is verified. If, on the other hand, the structure is not verified, improvements can be planned by means of reinforcement plating or injections, or by inserting new elements made of different materials, such as reinforced concrete shear walls, beams, columns, ring beams, or ties.
Working in this way, it is no longer necessary to verify the individual elements, since their contribution is implicitly accounted for during the analysis of the entire structure.
The 3Muri model, by studying the elasto-plastic behavior of the elements, makes it possible to evaluate at every instant the conditions of the individual elements and of the overall structure. The verification is therefore obtained in performance-based terms, i.e., in terms of the structure’s capacity to undergo displacements greater than those required by the code.
The data window presents the displacement values, and the stress and deformation characteristics of the nodes for the various walls making up the structure, for each sub-step of the analysis. In this window, every value can be selected, and it is also possible to export the results to other programs (Word, Excel, etc.).
The deformed shape trend is also displayed, both in plan and for the individual wall; the different colors highlight the progression of damage in the various macro-elements. By observing the color shades shown in the deformed wall map, it is easy to identify the damaged macro-elements and the cause of the damage (shear or flexural-axial failure).
For all undamaged elements, it is also possible to assess the tendency toward damage, distinguishing whether they enter the plastic range due to shear or flexural-axial behavior. This type of visualization applies not only to masonry elements but also to those made of reinforced concrete, steel, or timber.
This tool shows great potential for managing possible retrofitting interventions on existing buildings, as it proves highly effective in identifying the areas requiring intervention.
The nonlinear static (pushover) analysis is commonly known as the global analysis of the building. All global analyses require the building to have good box-like (diaphragm) behavior. Design practice sometimes presents cases in which the limited stiffness of floor diaphragms over portions of the structure can significantly influence the overall behavior of the building. Walls connected to the structural context through floor diaphragms of limited stiffness may make it necessary to verify individual walls.
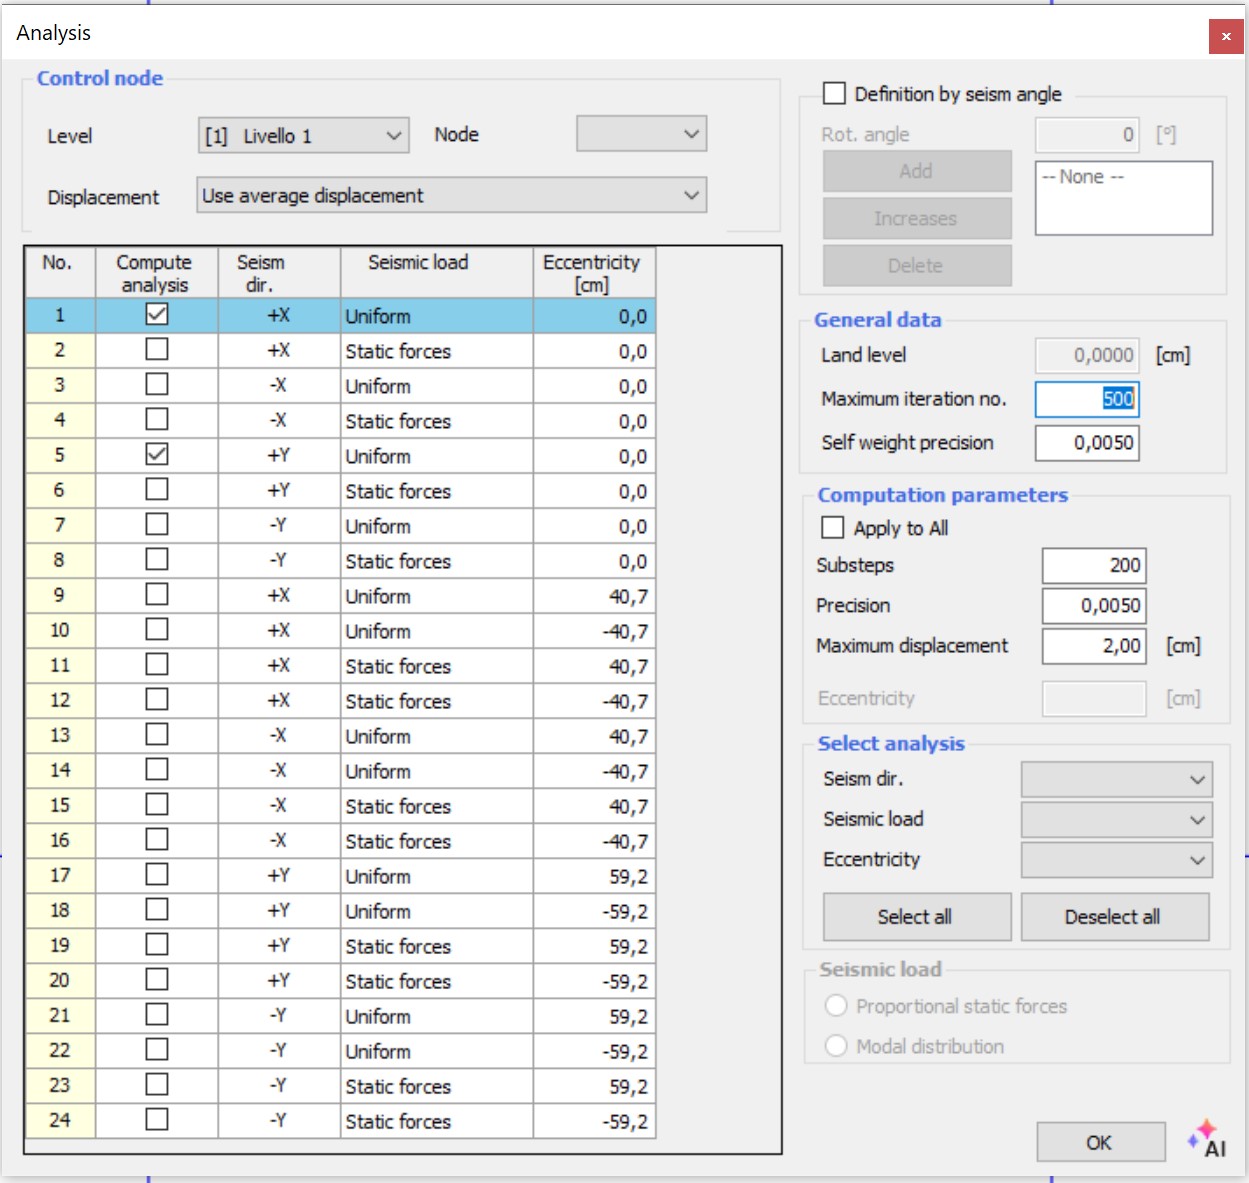
A new function allows one or more walls to be graphically selected for verification. For each wall, the program automatically generates 4 analyses to account for the 2 directions combined with 2 different load distributions.
S.T.A. DATA offers software and services for structural calculation. Practical, truly operational tools, created by a team of expert professionals, to solve every need.
